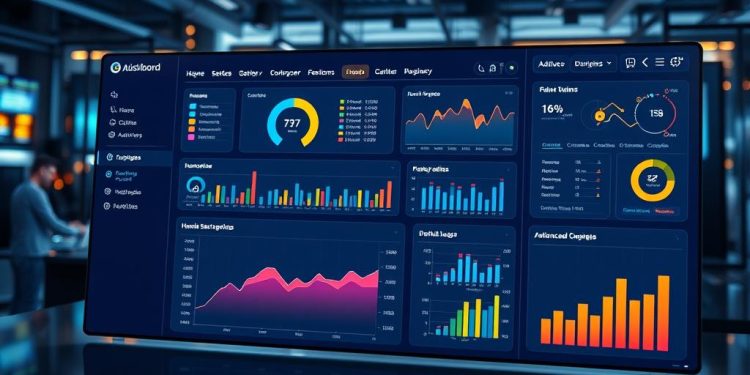
In today’s data-driven landscape, leveraging AI in data visualization has become essential for businesses seeking efficiency and clarity. As artificial intelligence evolves, it streamlines the process of transforming complex datasets into understandable visual formats, eliminating the often tedious manual tasks involved in creating reports. Traditional methods require significant human effort, such as designing static dashboards and crafting interactive visualizations, which can hinder real-time decision-making.
Moreover, static dashboards typically limit monitoring to just a handful of metrics, which is inadequate as the volume of data skyrockets. However, with the emergence of automation tools, companies can now harness powerful dynamic dashboards that not only visualize vast amounts of information but also predict trends through advanced predictive analytics.
By embracing AI, you can anticipate insights from your data without the need for extensive technical expertise. As we explore the transformative impact of AI in automating data visualization, you’ll discover how this technology is reshaping the way businesses interpret and act on their data.
Understanding the Importance of Data Visualization
Data visualization plays a vital role in the modern landscape of business decisions. By translating complex data into visual formats, it allows for easier interpretation and engagement, ultimately leading to more informed choices. Through graphical representation, users can quickly grasp essential insights and identify patterns that can drive strategic initiatives.
Defining Data Visualization
Data visualization refers to the graphical representation of data intended to convey insights clearly and efficiently. Effective visualization helps organizations tackle complex data, transforming overwhelming information into understandable formats. Techniques range from simple charts to intricate dashboards that facilitate real-time data analysis.
The Role of Data Visualization in Business Decisions
In today’s fast-paced environment, the ability to draw actionable insights from data is crucial for business success. Visualization tools enhance the speed at which data can be understood, especially in scenarios requiring advanced predictive analytics or machine learning. Organizations that leverage these tools tend to make data-driven decisions twice as frequently compared to their peers, improving overall performance and maintaining market leadership.
Challenges with Traditional Data Visualization Methods
Despite the advantages, traditional data visualization methods face several challenges. Issues such as data complexity, reliance on IT infrastructure, and static dashboards hinder organizations from maximizing their data potential. User training is often required to navigate complex visualizations and avoid misinterpretation. Furthermore, ensuring data privacy and compliance with regulations is critical, as breaches can compromise security and lead to legal repercussions.
| Visualization Technique | Key Benefits | Challenges |
|---|---|---|
| Line Charts | Excellent for showing trends over time | Can become cluttered with too much data |
| Choropleth Maps | Ideal for geographical data representation | Requires a solid understanding of geography |
| Interactive Dashboards | Enhance user engagement and understanding | Depend on effective design and layout |
| Candlestick Charts | Essential for tracking financial asset movements | May confuse non-experts |
Overall, understanding data visualization is fundamental for your organization to thrive in a complex data-driven landscape. By addressing the inherent challenges and leveraging effective techniques, you can enhance your company’s decision-making capabilities and promote a culture of data literacy.
The Rise of AI in Data Visualization
The landscape of data visualization is rapidly transforming with the rise of AI technologies. You may wonder how this affects your ability to comprehend and make decisions based on large volumes of data. AI in data visualization harnesses advanced algorithms to analyze extensive datasets and generate visual representations that drive essential insights for your business.
What is AI in Data Visualization?
AI in data visualization refers to leveraging artificial intelligence and machine learning technologies to automate the analysis and presentation of data in visual formats. This approach enables organizations to process unprecedented amounts of information quickly. By 2025, it is expected that over 180 zettabytes of data will be generated globally, with 80% classified as unstructured. As a result, AI-driven tools have become indispensable for parsing through this vast data landscape intuitively.
Benefits of Integrating AI into Data Visualization
Integrating AI into your data visualization processes brings numerous benefits that enhance your organization’s analytical capabilities. Key advantages include:
- Automation tools allow for accelerated data processing, reducing the manual workload on data scientists and analysts.
- AI-generated visuals simplify complex datasets, promoting better understanding and quicker decision-making.
- Real-time data visualization enables immediate responses to changes, streamlining your operations and improving agility.
- Natural language processing (NLP) empowers users to create visualizations through simple text prompts, making data interaction more intuitive.
- Predictive analytical capabilities enhance your ability to forecast trends, enabling effective planning and strategic adjustments.
Tools like Power BI utilize Smart Discovery to automatically analyze large datasets, highlighting patterns that can expedite your data exploration. Companies employing AI algorithms can detect anomalies and conduct thorough root-cause analyses more efficiently. Given that only 20% of organizations unlock their data’s intrinsic value, those who embrace AI in data visualization will likely gain a competitive edge.
As the demand for AI analytics tools continues to grow, organizations can expect an ongoing evolution of AI features in data visualization environments. The incorporation of advanced technologies, such as augmented reality and 3D modeling, is on the horizon, further enriching your data interpretation experience. Leveraging these AI advancements positions your business to maximize productivity and revenue growth across various sectors.
| Advantage | Description |
|---|---|
| Automation | Reduces manual tasks for analysts, allowing them to focus on high-level insights. |
| Real-time Analysis | Aids in quick decision-making by visualizing data as changes occur. |
| User-friendly Interaction | NLP capabilities simplify data manipulation through natural queries. |
| Predictive Insights | Facilitates informed planning with accurate forecasts based on data trends. |
AI in Data Visualization: Transforming Data Analysis
The emergence of AI in data visualization is reshaping how businesses analyze and interpret data. By utilizing advanced automation tools, organizations can enhance their analytical capabilities and streamline processes. This transformation allows you to create visualizations and dynamic dashboards that adapt in real-time to the changing data landscape.
Automation Tools That Enhance Data Visualization
Automation tools powered by AI significantly reduce the time necessary for creating visual representations. You can process millions to billions of data points in real time, allowing for rapid analysis without sacrificing accuracy. These tools enable data analysts to focus more on interpreting results rather than spending considerable time on manual data handling. The integration of AI accelerates data cleaning and preprocessing, providing a more efficient work environment.
Dynamic Dashboards and Real-Time Insights
Dynamic dashboards equipped with real-time insights are essential for modern organizations. These dashboards can personalize displays based on user preferences, allowing for easy navigation through complex datasets. Anomaly detection features keep you informed about significant deviations, fostering timely decisions to address potential issues. The ability to manipulate data in real time empowers decision-makers to explore various scenarios right at their fingertips.
Predictive Analytics for Better Forecasting
Predictive analytics enables you to forecast future trends by analyzing historical data. This capability enhances proactive decision-making across various industries, such as healthcare and manufacturing. The AI-driven tools help in identifying patterns, allowing organizations to manage resources effectively based on forecasted outcomes. You benefit from the valuable insights provided by predictive visualizations, which facilitate better business strategies.
| Feature | Description | Benefit |
|---|---|---|
| Automation Tools | AI algorithms streamline the data processing and visualization creation. | Increased efficiency, allowing analysts to focus on interpretation. |
| Dynamic Dashboards | Dashboards that adapt in real time and personalize user experiences. | Enhanced interactivity leads to better decision-making capabilities. |
| Predictive Analytics | Forecasting future trends based on historical data. | Proactive resource management and effective strategy development. |
Real-World Applications of AI in Data Visualization
The integration of AI into data visualization has proven beneficial across various sectors, facilitating enhanced decision-making and operational efficiency. As businesses continue to grapple with the exponential data growth projected to exceed 180 zettabytes annually by 2025, the need for effective data management techniques becomes critical. Various industry-specific use cases highlight how AI-driven data visualization tools enable organizations to derive actionable insights from massive datasets.
Industry-Specific Use Cases
Let’s explore some compelling examples of AI applications across different industries:
- Finance: AI automates fraud detection by analyzing millions of bank transactions each second, allowing financial institutions to identify suspicious activities in real time.
- E-commerce: Predictive analytics helps retailers personalize recommendations based on consumer behavior, optimizing stock levels while minimizing waste.
- Healthcare: AI-driven visuals transform clinical data analysis, translating insights into improved patient outcomes and operational strategies.
- Retail: Real-time data visualization allows retailers to respond immediately to sales performance metrics across different regions, showcasing trends that might remain unnoticed without AI support.
- Manufacturing: Companies employing augmented reality (AR) for on-site visualization can reduce equipment checks, enhancing operational efficiency.
Case Studies Demonstrating Successful AI Implementation
Various case studies exemplify the remarkable advantages of integrating AI into data visualization:
| Industry | Application | Outcome |
|---|---|---|
| Finance | Automated fraud detection | Enhanced risk detection and reduced fraudulent transactions |
| E-commerce | Personalized product recommendations | Increased customer engagement and optimized inventory |
| Healthcare | Clinical data visualization | Improved patient treatment strategies and outcomes |
| Retail | Real-time performance monitoring | Quick data-driven decisions and improved sales management |
| Manufacturing | Augmented reality data insights | Higher operational efficiency with fewer equipment checks |
Conclusion
The integration of AI in data visualization marks a transformative era for businesses striving to become truly data-driven. As organizations face increasing competition, utilizing AI in data visualization allows you to harness powerful insights that were previously challenging to uncover. With automation capabilities that streamline the creation of visualizations and predictive analytics that enhance decision-making processes, AI empowers you to focus on strategic initiatives rather than getting lost in manual reporting tasks.
By 2025, it is anticipated that nearly 30% of large enterprises will leverage AI for predictive analytics, enhancing their sales metrics and overall performance. Incorporating AI into your data visualization strategies not only delivers significant benefits, such as reduced reporting time and improved accuracy, but also enables meaningful interactions with data across diverse sectors—from finance and healthcare to marketing and e-commerce. This technology is not just a trend; it is essential for cultivating a culture of informed, data-driven decisions that strengthen your business’s competitive edge.
As the market for AI-powered data visualization evolves, embracing these innovations will be crucial. The ongoing advancements in AI tools enhance your ability to interpret vast datasets engagingly and understandably, ensuring you can pivot quickly when the need arises. In an environment where data is continuously generated, the ability to visualize and analyze it effectively positions your organization to navigate challenges creatively and seize opportunities swiftly.

