
Open Data Movements Expanding Access to Reliable Information
Open Data Movements are reshaping the way information is shared and utilized across various sectors. By promoting data democratization, these movements ensure that reliable information

Open Data Movements are reshaping the way information is shared and utilized across various sectors. By promoting data democratization, these movements ensure that reliable information

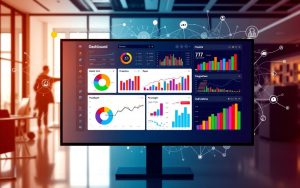
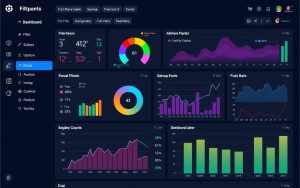
Today, the need for enhancing Dashboard UX has become crucial for businesses aiming to streamline their decision-making processes. Research reveals that 62% of users find

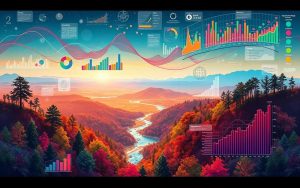
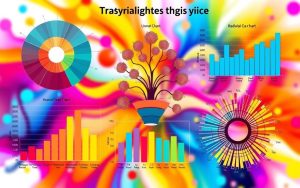
The landscape of data presentation is evolving rapidly, driven by the integration of 3D and immersive charts. These innovative design tools are not just enhancing

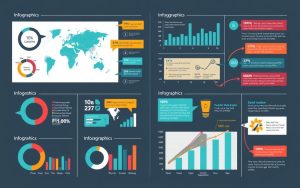
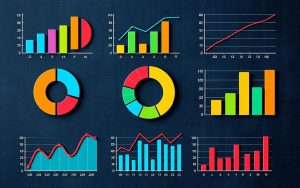
In today’s data-driven world, effectively conveying information is crucial for meaningful insights. The use of chart types in data visualization plays a significant role in

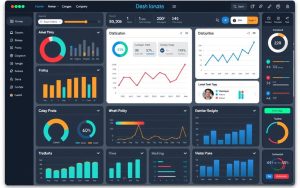
As we approach 2025, the landscape of interactive dashboard innovations is undergoing a remarkable transformation. Organizations are increasingly turning to dashboard technology that not only
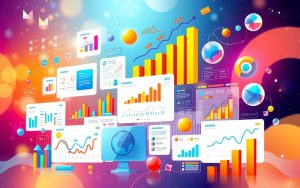
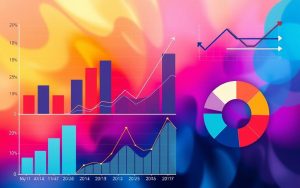
As businesses increasingly rely on data to drive decision-making processes, the importance of effective data visualization trends cannot be overstated. The projected growth of the

The ever-growing volume of data generated globally demands your attention as a conscientious user of open data platforms. By 2025, an estimated 175 zettabytes of

In today’s data-driven landscape, leveraging AI in data visualization has become essential for businesses seeking efficiency and clarity. As artificial intelligence evolves, it streamlines the

In today’s data-driven world, effectively representing complex datasets is crucial for businesses looking to leverage insights and enhance decision-making processes. Data visualization plays a vital

In today’s rapidly changing business landscape, interactive dashboards have become essential tools for organizations seeking to enhance their decision-making processes. Leveraging real-time data visualization, these
In today’s data-driven world, the art and science of data storytelling emerges as a vital skill for professionals across various fields. It combines the analytical
In today’s data-driven world, effective dashboard design is essential for businesses aiming to visualize critical metrics that drive informed decision-making. However, many designers encounter common
In an age where data is abundant, transforming that data into compelling narratives is crucial. Storytelling with dashboards offers an innovative approach to combine effective
Filters in dashboards play a crucial role in enhancing user interaction and enabling engaging data visualization experiences. By allowing you to customize the view of

In today’s fast-paced business environment, the ability to harness live data has transformed how organizations operate. Real-Time Dashboards have emerged as essential tools that allow

The transformation from static to interactive dashboards marks a significant trend in the realm of data visualization. As you delve deeper into today’s data-driven environment,

In today’s digital landscape, where information overload is common, it becomes essential to captivate your audience’s attention. Data Animation offers a compelling solution by transforming

In the landscape of modern business intelligence, interactive dashboards stand out as invaluable tools that can transform raw data into actionable insights. Designed to cater
In the realm of data visualization, using annotation and callouts can significantly elevate the impact of your presentations. These tools act as effective annotations that

In today’s data-driven world, minimizing cognitive load is critical for effective communication. Research reveals that 90% of the information transmitted to your brain is visual,

In today’s digital business landscape, the importance of combining data sources cannot be overstated. Organizations are increasingly leveraging various data sets from sources such as

Color Theory plays an essential role in the realm of data visualization, significantly impacting your ability to communicate insights effectively. Understanding how colors influence perception

Welcome to your comprehensive guide on data visualization techniques, where heatmaps and treemaps take center stage. These powerful tools not only serve distinct purposes in

Open data is revolutionizing the way organizations and individuals tackle challenges, unlocking new pathways for innovation. By offering public access to a wealth of information,

In today’s interconnected world, data privacy is a paramount concern that affects every individual. With the rise of technology, the access, use, and collection of

Welcome to the evolving world of real-time dashboards, where integrating APIs serves as the backbone for dynamic data visualization. By tapping into live data through

In today’s data-driven landscape, effective visualization is more crucial than ever. The data visualization market was valued at approximately $8.85 billion in 2019 and is

Ensuring your data is ready for effective visualization begins with the critical process of data cleaning. In an era where poor data quality can cost

In the realm of data presentation, recognizing and avoiding chart junk is crucial for achieving visual clarity. Coined by Edward Tufte in his influential work
In today’s data-driven world, mastering advanced chart types is essential for effective data presentation. These innovative visual tools allow you to transform complex datasets into
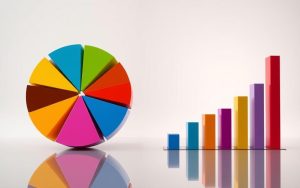
Understanding the right time to use Pie Charts vs. Bar Charts is essential for effective data visualization. In a world where clear communication is key,
Are you ready to unlock the full potential of your data? Combination charts provide an innovative approach to visualizing multidimensional data, enabling you to tell
When it comes to data visualization, selecting the appropriate chart types is crucial for effectively conveying your message. Whether you are utilizing pie charts, bar
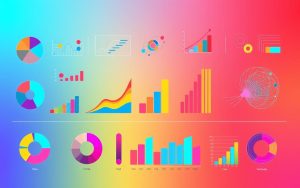
Welcome to an engaging exploration of the Evolution of Chart Types, where we journey through the fascinating realm of data visualization. From the early, simplistic